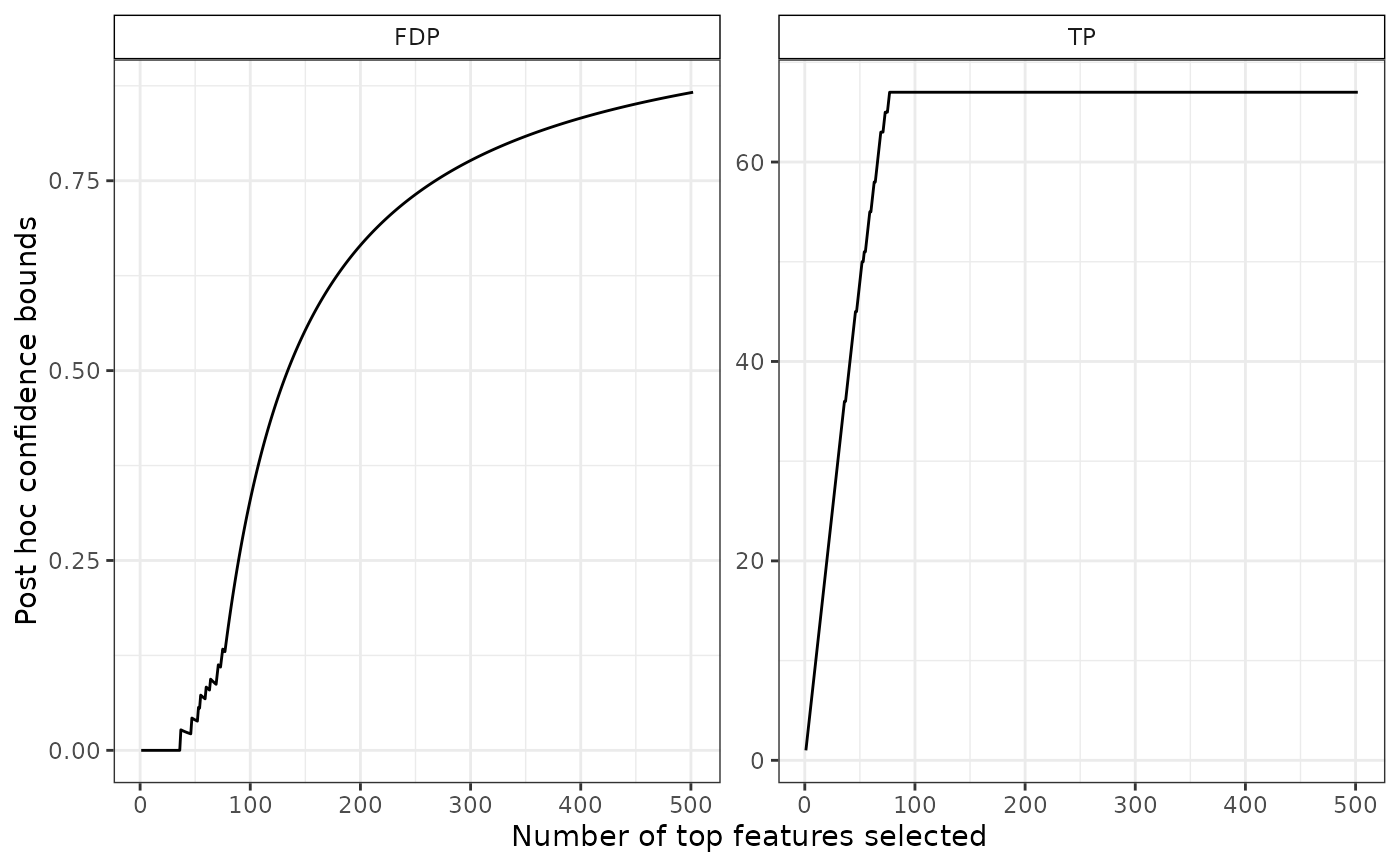
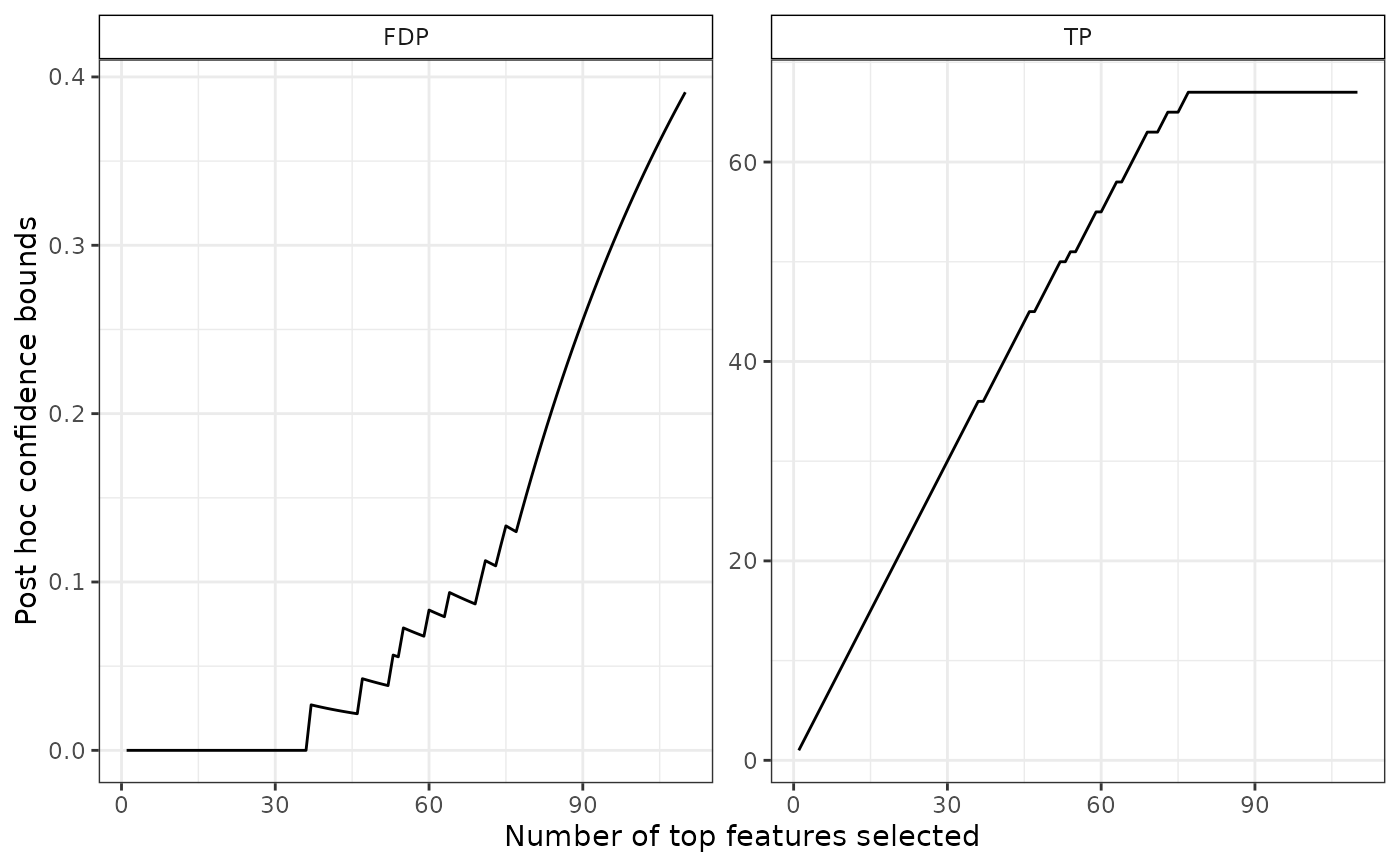
Plot confidence bound on the true/false positives among most significant items
Source:R/SansSouci-class.R
plot.SansSouci.RdPlot confidence bound on the true/false positives among most significant items
Examples
# Generate Gaussian data and perform multiple tests
obj <- SansSouciSim(m = 502, rho = 0.5, n = 100, pi0 = 0.8, SNR = 3, prob = 0.5)
res <- fit(obj, B = 100, alpha = 0.1)

# confidence curve
plot(res)


# confidence curve for a subset of hypotheses
S <- which(pValues(res) < 0.1 & foldChanges(res) > 0.3)
plot(res, S = S)
